
Strategy of mathematics of motion
An example of uniform accelerated motion with ticker timer
If we recognize that kinematics is infused with concepts from calculus, we will be able to devise a strategy to facilitate its adoption. As an example, we'll use uniformly accelerated motion, which is covered in first-grade high school curriculum. It is easiest to demonstrate this type of motion during free fall. Free fall is actually unjustifiably interpreted as a particular instance of uniformly accelerated motion simply because the acceleration g is due to gravity.
In Figure 1, we conduct an experiment wherein a 1 kg weight is allowed to fall freely. The weight is suspended from a paper ribbon that is passed through a ticker tape timer, or vibrator. Because the electromagnetic device operates at the frequency of the electrical grid, which is 50 Hz (in Europe), the ticker's key will record the dots on the tape every 1/50 of a second while it is in free fall. First, we will take five key intervals, or 1/10 of a second, as a unit of time. (5·0.02 s = 0.1 s; 1/50 s = 0.02 s). Students can mentally picture an interval of a tenth of a second.

Figure 1. A paper tape that will record the distance traveled in 1/50 second intervals is pulled by a weight of one kilogram.
Now we attach the paper tape to the school board as ordinate to create a coordinate system. Then we draw the abscissa with chalk as the time axis, applying marks for every tenth of a second (Figure 2.)
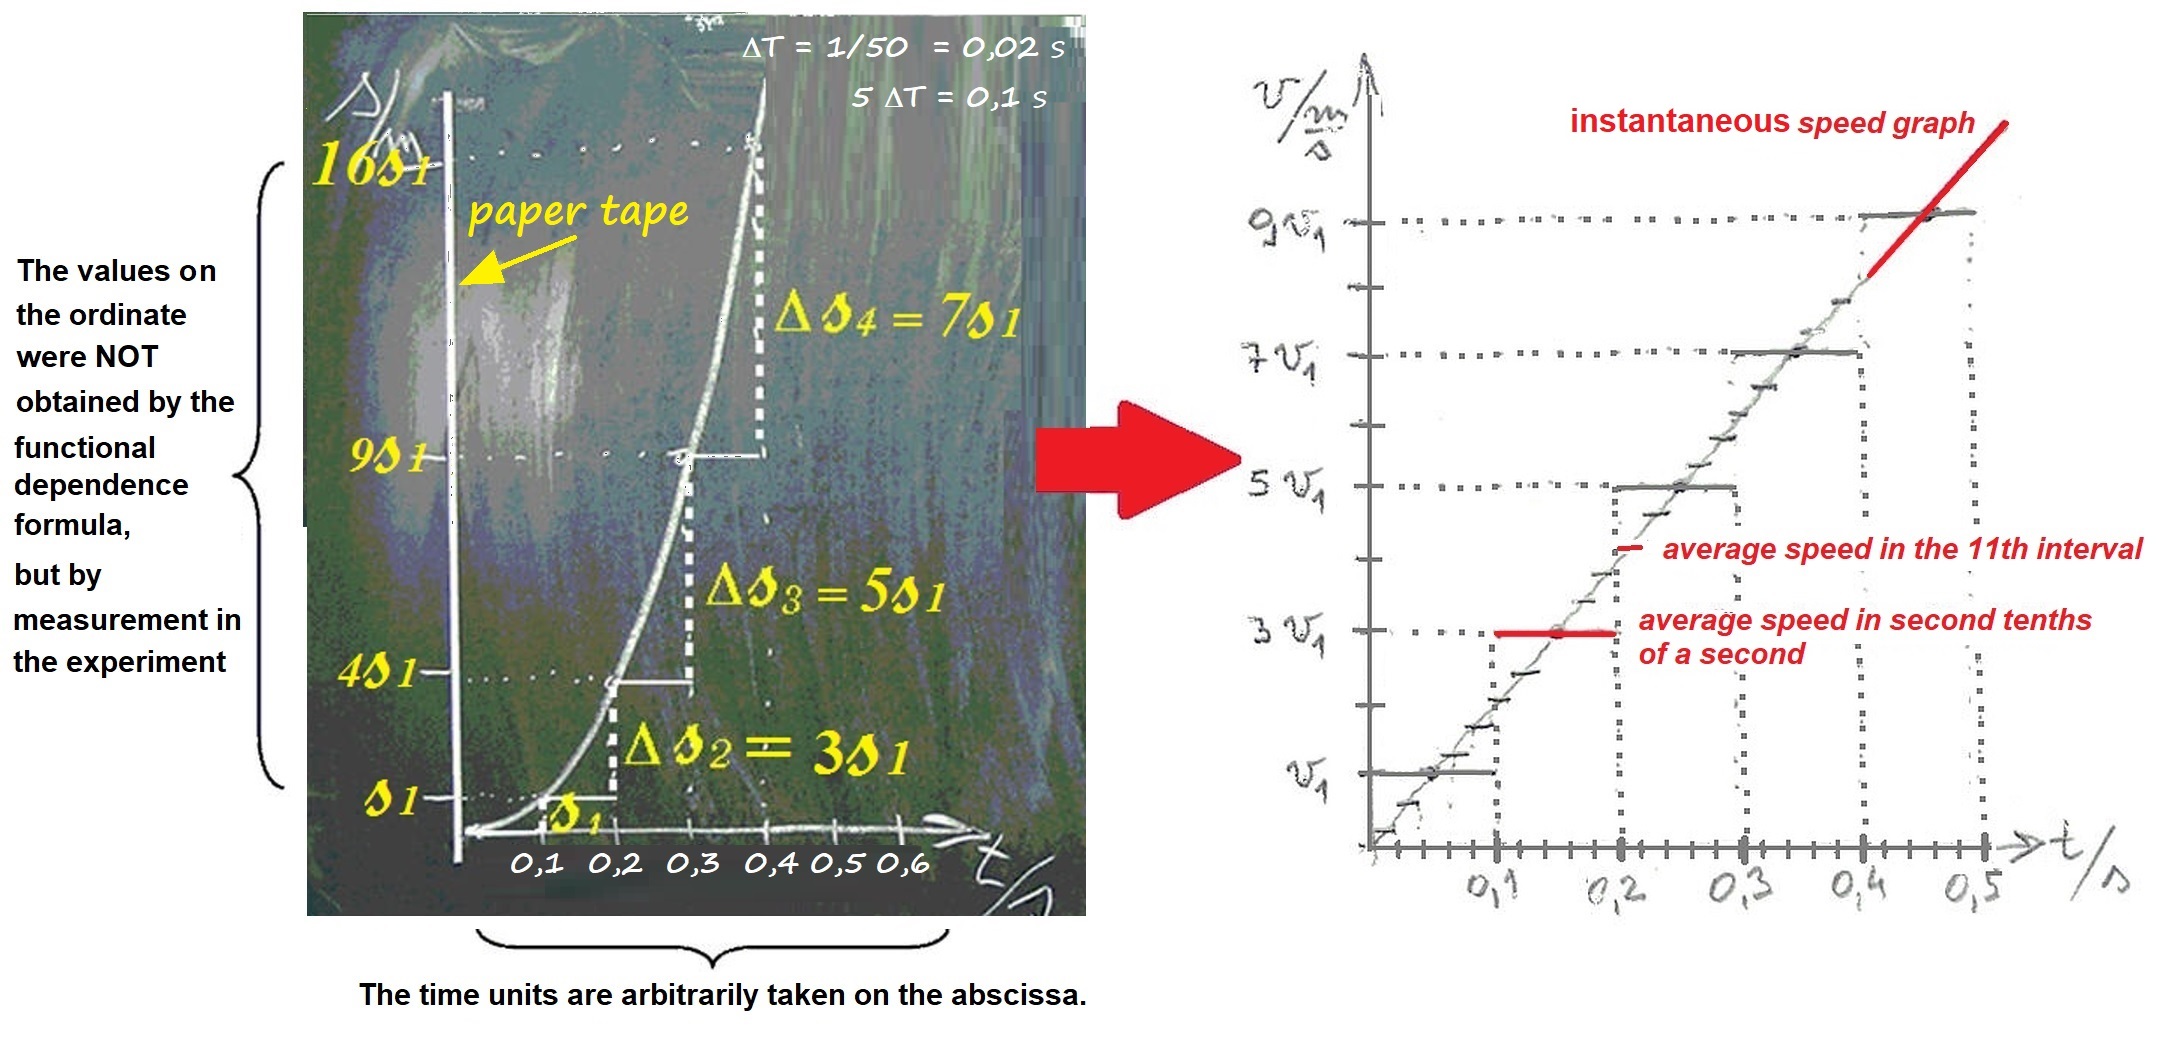
Figure 2. We highlight every fifth dot on the tape, and we draw pairs of values for the traveled distances and corresponding times in the coordinate system. We can create a graph of the path's dependence on time by joining the points we have obtained, which is known as the ″s-t graph″.
The values on the ordinate were NOT entered using the well-known formula s = g·t²/2, as they were clearly from the experiment. This is a significant difference between physics and mathematics. The physicist must now determine the functional dependence obtained during the experiment. We will be able to determine how this dependence is quadratic with our mathematical knowledge. That is to say, a distance traveled in twice the time is four times longer than a distance traveled in first time unit, etc. The numbers 4, 9, 16, 25,... are all squares. And the paths covered within certain intervals increase linearly as odd numbers. The distance traveled in the second tenth of a second is three times longer than that in the first tenth, the distance in the third tenth is five times longer, etc. s1, 3s1, 5s1, 7s1, (Figure 2.)
The students are then given the difficult task of drawing a v-t graph based on the s-t graph. At the same time, they are rarely given guidance on how to do it. The algorithm for the procedure is as follows: First, we literally transfer the time axis to the v-t graph because we see the change in speed at the same time. Then, along the s-t graph curve, we mark the legs of the pseudo right triangle for each unit of time. The vertical leg represents the distance traveled in that unit of time, while the horizontal leg represents that time. Then we divide the vertical by the horizontal leg and record the result in the v-t graph. (Figure 2. right)
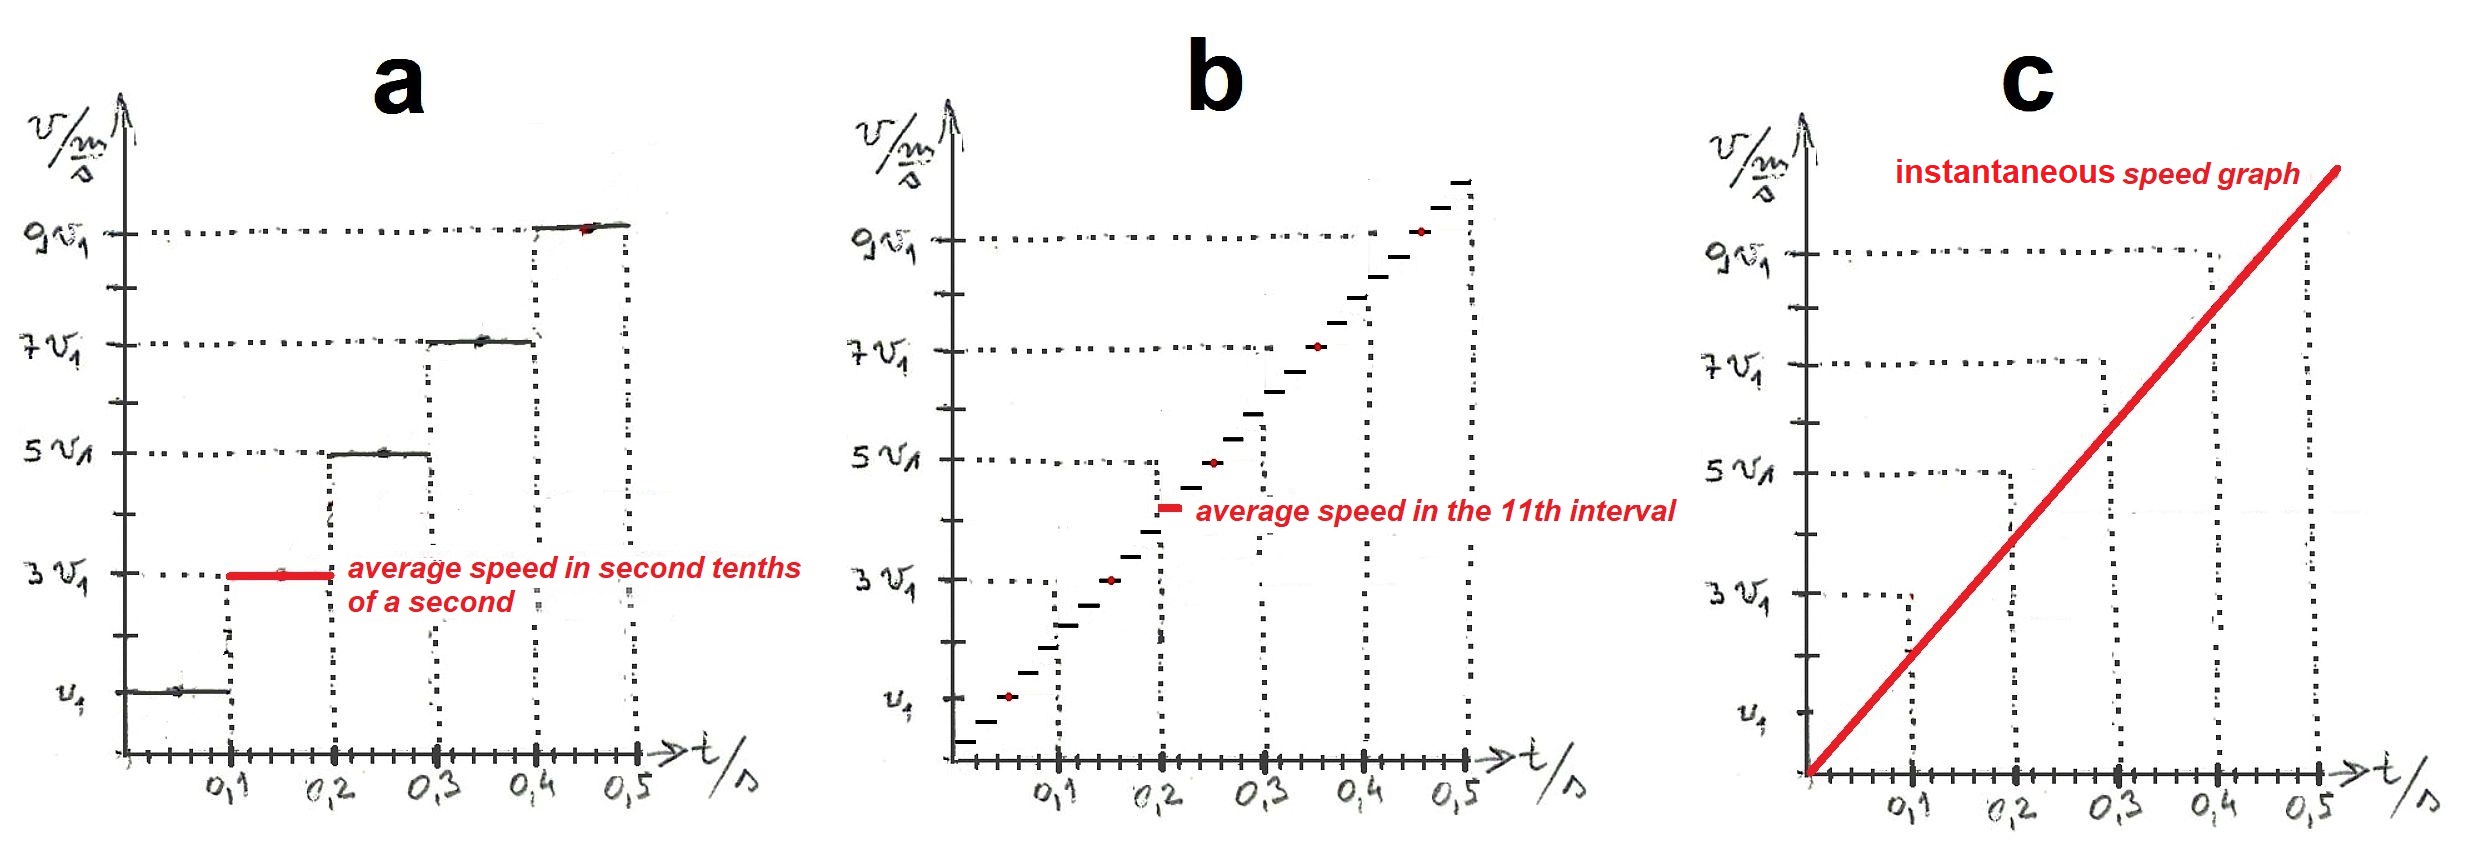
Figure 3. Based on the s-t graph students are assigned to draw a v-t graph. What algorithm do they need to apply?
Using the above procedure, we will obtain "stairs" of average speeds in a single unit of time, 0.1 s, on the v-t graph. (See Figure 3, a.) The "stairs" are obviously rough. Now, let's try drawing such "stairs" using 1/50 of a second as a unit of time. (See Figure 3 b). It is clear that the "stairs" have become finer. And if we try to draw the "stairs" for every millionth of a second, we will be unable to distinguish them because they are finer than the thickness of the chalk we are using, resulting in a straight line of instantaneous speeds. (See Figure 3, c.)
The same algorithm is needed in the task of drawing an a-t graph based on the v-t graph.
The described procedure is essentially the derivation of the function as it is applied in calculus.

And the hierarchy of graphs s-t ⇒ v-t ⇒ a-t, represents the transition to the first and second derivatives of the path in time. Of course, this is not mentioned in the first grade, but these are the elements of calculus, which, due to its abstractness, represents a very demanding material, which most students are not up to.
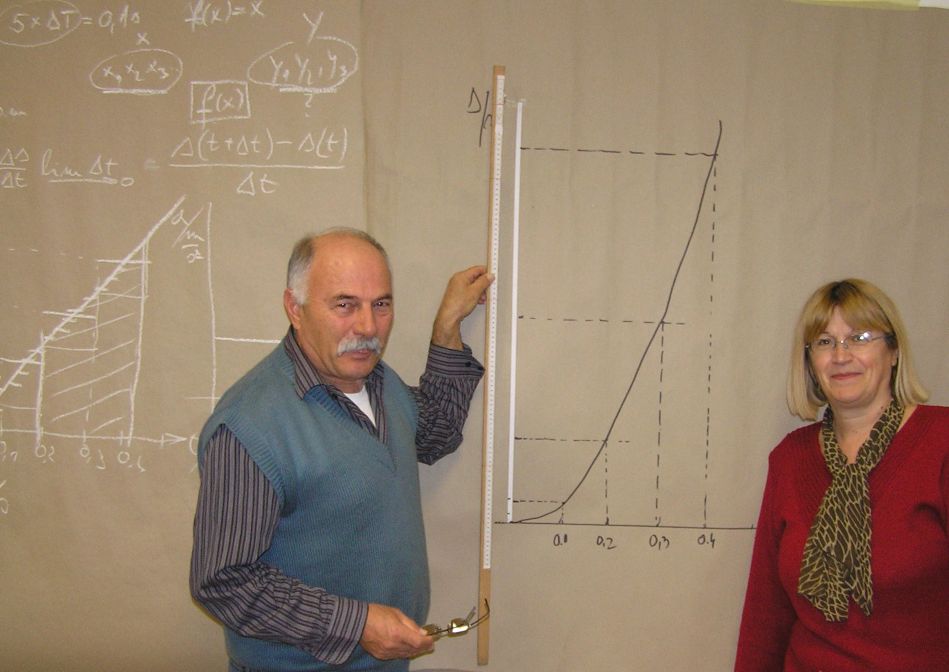
Figure 4. Physics teachers performed this experiment at a professional development workshop. They got a parabola based on the dots on the ribbon.
The same is true for tasks that require drawing a lower graph from a higher graph (by degree of derivation). A very common task is to draw a s-t graph from a given v-t graph. And as an aid it is said that the surface beneath the graph have a meaning of the path traveled. This statement is actually an instruction for a definite integral that has been simplified to polygons because the motions are uniform.
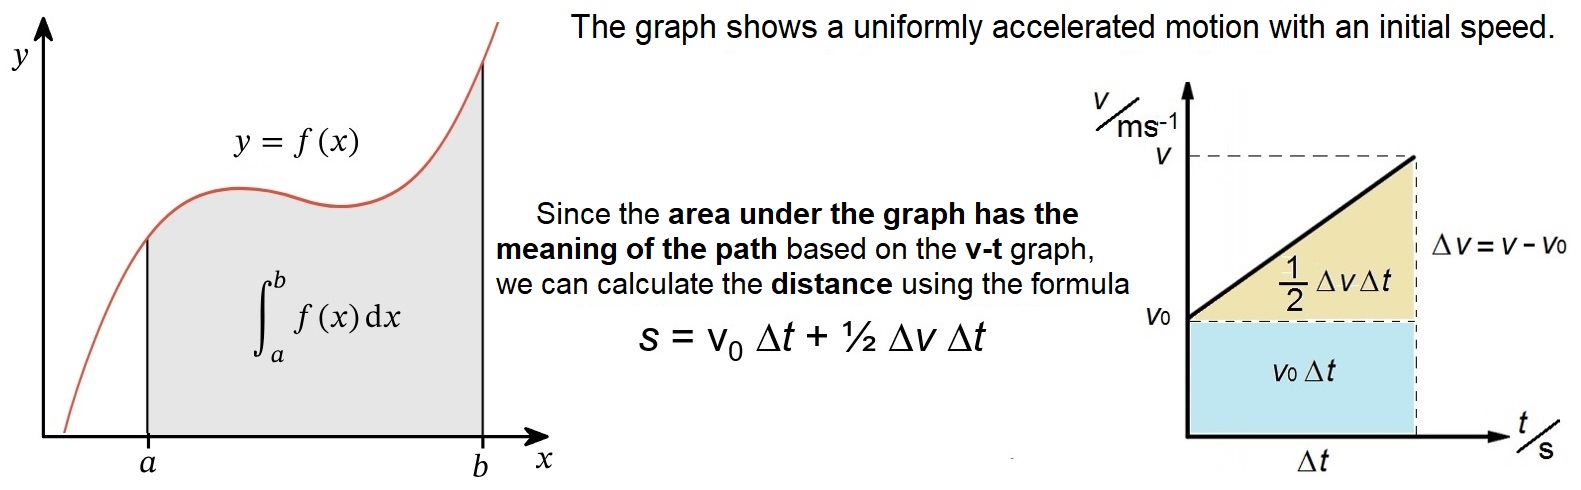
Figure 5. Based on the area under the v-t graph, the distance traveled in time Δt can be calculated.
So tasks in which you are asked to based on one graph, eg. v-t (speed - time) to draw another graph, eg. a-t (acceleration - time) they essentially require applying calculus, specific derivation, skipping limes as the base difference between average and instantaneous value.